|
|
|
| This document is available in: English ChineseGB Deutsch Francais Russian |

by Arnout Engelen <arnouten(Q)bzzt.net> About the author: Arnout Engelen is a CS student at the University of Nijmegen, the Netherlands, and an employee at TUNIX, an internet security company. In his spare time, he likes to run distances and play the tenor sax. Content: |
Optimizing C/C++ programs using the GProf profiler
Abstract: One of the most important things to keep in mind while optimizing an application is: optimize where it counts. It is no use to spend hours optimizing a piece of code that usually runs for only 0.04 seconds anyway. GProf provides a surprisingly easy way to profile your C/C++ application and spot the interesting pieces right away. A small case study shows how GProf was used to reduce the running time of a real-world application from over 3 minutes to under 5 seconds, by identifying 2 data structures as important and optimizing those.
Historically, the program goes back as far as 1982, when it was introduced on the
the SIGPLAN Symposium on Compiler Construction. It is now a standard tool available
on virtually all flavors of UNIX.
|
event2dot
executable which translates a pathalizer 'events' file to a graphviz 'dot' file.
In short, it reads the events from a file, storing them as graphs (with pages as nodes, and transitions between pages as edges). This collection of graphs is then 'summarized' into one big graph, which is printed in the graphviz 'dot' format.
On my machine, a run of event2dot took more than 3 minutes on this input:
real    3m36.316s
user    0m55.590s
sys     0m1.070s
g++ -pg dotgen.cpp readfile.cpp main.cpp graph.cpp config.cpp -o event2dot
We can now run event2dot again on our test-eventsfile. During this run,
profiling information on event2dot will be gathered, and a 'gmon.out' file
will be generated. We view the result by running 'gprof event2dot | less'.
gprof now shows us the following functions are important:
 % cumulative  self              self     total
 time seconds  seconds  calls s/call s/call name
43.32   46.03  46.03 339952989  0.00  0.00 CompareNodes(Node *,Node *)
25.06   72.66  26.63    55000   0.00  0.00 getNode(char *,NodeListNode *&)
16.80   90.51  17.85 339433374  0.00  0.00 CompareEdges(Edge *,AnnotatedEdge *)
12.70  104.01  13.50    51987   0.00  0.00 addAnnotatedEdge(AnnotatedGraph *,Edge *)
 1.98  106.11   2.10    51987   0.00  0.00 addEdge(Graph *,Node *,Node *)
 0.07  106.18   0.07        1   0.07  0.07 FindTreshold(AnnotatedEdge *,int)
 0.06  106.24   0.06        1   0.06 28.79 getGraphFromFile(char *,NodeListNode *&,Config *)
 0.02  106.26   0.02        1   0.02 77.40 summarize(GraphListNode *,Config *)
 0.00  106.26   0.00    55000   0.00  0.00 FixName(char *)
The most interesting column is the first one: this is the percentage of the running time of the program that is spent in this function.
CompareNodes. A quick grep shows
CompareNodes is called only by CompareEdges, which in turn is only called by
addAnnotatedEdge - both of which are also in this list. This looks like an interesting
point to do some optimizing.
We notice addAnnotatedEdge is traversing a linked list. Though easy to implement, a linked
list is not the best of data types. We decide to replace g->edges with a binary tree: this should make
finding stuff in the structure much faster, while still being able to 'walk' through it.
real    2m19.314s
user    0m36.370s
sys     0m0.940s
%   cumulative self           self    total
 time   seconds seconds calls  s/call  s/call name
87.01     25.25  25.25  55000    0.00    0.00 getNode(char *,NodeListNode *&)
10.65     28.34   3.09  51987    0.00    0.00 addEdge(Graph *,Node *,Node *)
It looks like the functions that used to take up more than half of the time have now been reduced to irrelevant details! Let's try this again: we replace the NodeList by a NodeHashTable.
This is also clearly a big improvement:
real    0m3.269s
user    0m0.830s
sys     0m0.090s
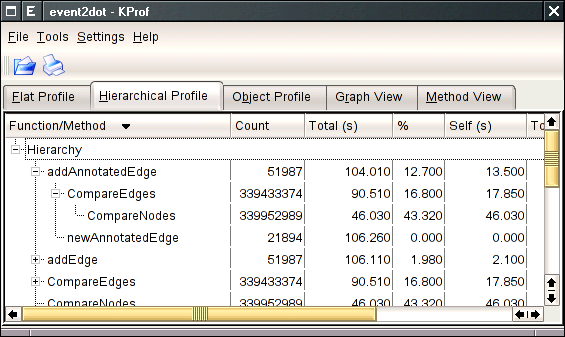 There are several profilers available that use the gprof data, for example KProf (screenshot) and cgprof. Though the graphical views are a nice touch, personally I think the commandline gprof is more convenient.
perl -d:DProf mycode.pl and view the results with dprofpp. If you can compile your Java program with gcj, you can just use gprof, however only single threaded Java code is currently supported.
|
Webpages maintained by the LinuxFocus Editor team
© Arnout Engelen "some rights reserved" see linuxfocus.org/license/ http://www.LinuxFocus.org |
Translation information:
|
2005-04-01, generated by lfparser version 2.52