|
|
|
| This document is available in: English Castellano Deutsch Francais Nederlands Russian Turkce |

by Stefan Blechschmidt <sb(at)sbsbavaria.de> About the author: Being a trained electrician, I found myself in 1990 in front of a CAD workstation to develop a switch and control station. Obviously, I got infected by a then unknown 'virus', and that's just fine. Translated to English by: Jürgen Pohl <sept.sapins(Q)verizon.net> Content:
|
Temperature Monitoring With Linux (Part 2)
Abstract:
In the November 2003 edition Temperature Monitoring With Linux I explained a circuit which enables us to collect temperature data through Linux. To evaluate the temperature data we should store them in a database. To get the full benefit of this article we will graphically display the data through a web interface. |
Some working applications should already be installed on your computer
As we are noticing, this article is for the somewhat advanced Linux user. For those which are not there yet it will be a good introduction ;-)
In MySQL the program mysql provides the interface to
the database. With the command
mysql -u root -p mysql we connect to the MySQL
monitor.
With the switch -u the
user will be entered. The
-u switch will request the password, and finally the
database to be used needs to be entered. In our case we are
selecting the MySQL database Manager.
You will get the mysql
> prompt to enter the SQL commands. At first we we
need to find out which kind of tables are in the database. The
command show tables;
does this.
mysql> show tables;
+-----------------+
| Tables_in_mysql |
+-----------------+
| columns_priv    |
| db              |
| func            |
| host            |
| tables_priv     |
| user            |
+-----------------+
6 rows in set (0.00 sec)
Now we have to build the database for our temperature data.
With the command create database
digidb we generate our database named digidb and
with the command exit we
may exit the monitor since additional commands will be entered
in a different way.
MySQL has an administrator which in general is also
named root. The default installation does not require a
password. With the command
mysqladmin -u root -p password geheim we are changing
the password for the user root to geheim.
To make this modification active, the table of the
administrator has to be read again, we are doing that with the
command mysqladmin -u root -p
flush-privileges. From now on the user root has
to provide the password for each access to the database.
Entering commands through the monitor is very complicated, however MySQL offers another possibility to enter commands.
To do this we are entering a text file with the SQL commands by adding a "<" to the command mysql.
To demonstrate this, we are writing a text file to generate the first table for sensor 0.
In this file sensor0.sql we are now writing the commands to build the table, that might look like this.
CREATE TABLE sensor0 (
  id int(11) NOT NULL auto_increment,
  monat char(3) NOT NULL default '',
  tag char(2) NOT NULL default '',
  dbtime timestamp(14) NOT NULL,
  zeit time NOT NULL default '00:00:00',
  messung decimal(4,2) NOT NULL default '0.00',
  PRIMARY KEY  (id)
) TYPE=MyISAM;
This will be entered with:
mysql -u digitemp -p digitemp
    < sensor0.sql
Since we are using 2 sensors we need only to copy the file
and modify the line CREATE TABLE
sensor0 to CREATE TABLE
sensor1.
At this point it may be convincing that entering the SQL commands by the means of a file has real advantages.
To show the newly generated tables we are using the command:
echo 'show tables' | mysql -u
    root -p digidb
, of course it also works the other way
around.
If we did everything correctly we will get the output:
  Enter password:
  Tables_in_digidb
  sensor0
  sensor1
A small Perl program will do the transfer of data into the database. For this our first Perl module (DBI) will be utilized, it will provide us with methods of database access.
#!/usr/bin/perl -w
#
# Digitemp preparing of  log file and saving in database

# sbs 2003-08-09
#
use DBI;
use strict;

# Initialize database

my $datasource = "dbi:mysql:database=digidb";
my $user = "root";
my $pass = "geheim";

my $db = DBI->connect($datasource, $user, $pass)
   or  "Verbindung zur Datenbank nicht möglich: " . $DBI::errstr;

# Filtering of Digitemp
while(<STDIN>) {
  chomp;
  # Skip output program name
  next if (m/Digi.*/);
  # Skip output blank line
  next if (m/^$/);
  # Skip all to Fahrenheit
  m/(.*).F.*/;
  my $templine = $1;

  # Divide temp line and save in variables
  my ($monat, $tag, $zeit, $sensor_txt, $sensor_nr, $grad_txt, $grad_wert)
  = split(/ /,$tempzeile);

  # Fill database
  $db->do( "insert into sensor$sensor_nr (monat, tag, zeit, messung)
  values ('$monat', '$tag', '$zeit','$grad_wert')")
    or die "do nicht möglich:  " . $db->errstr();

}# END- Digitemp filter

# close database
$db->disconnect;
The program does actually not do very much, it opens the database, reads the output it received from digitemp, filters everything we do not need and writes the relevant data into the correct database table.
The continuous collection of data is done with the well proven cron job:
0-59/15 * * * * root /root/bin/digitemp -a | /root/bin/digipipe.pl
That's all for the data collection, now to the web interface.
Perl offers us the proper environment for this task.
First we need to know the directory where Apache is
processing its CGI programs. They can be found in the
configurations file of Apache. Look for an entry like this
<Directory
    /usr/lib/cgi-bin>
.
Before we begin with the graphical output we will first build a program which provides us with the last messurement data.
It would be advantageous if you store those in a separate
subdirectory; you also have to make your program
executeable: chmod 755
programmname.
We need to limit the output to the last data and to entering them into a Perl-CGI program. This will be done with the SQL query.
#!/usr/bin/perl

use DBI;
use strict;

# Initialize database
my $datasource = "dbi:mysql:database=digidb";
my $user = "root";
my $pass = "geheim";

my $db = DBI->connect($datasource, $user, $pass)
   or  "Verbindung zur Datenbank nicht möglich: " . $DBI::errstr;

# database work parameter
my $sql;
my $sth;

# Sensor work parameter
my $temp;
my $zeit;

#Prepare HTML output
print "Content-type: text/html\n\n";

# Output of individual sensors measurements
  $sql = "select messung, zeit from sensor$i order by id desc limit 1;";

  $sth = $db->prepare($sql)
    or die "prepare nicht möglich";
  $sth->execute()
    or die "execute nicht möglich";
  ($temp, $zeit) = $sth->fetchrow_array();
  $sth->finish();

  print "<p>Temperatur Sensor$i: <b>[$temp]</b> $zeit</p>";

}

# Close database
$db->disconnect;
This example is not the most elegant, it shall only demonstrate how simple this job can be accomplished with Perl.
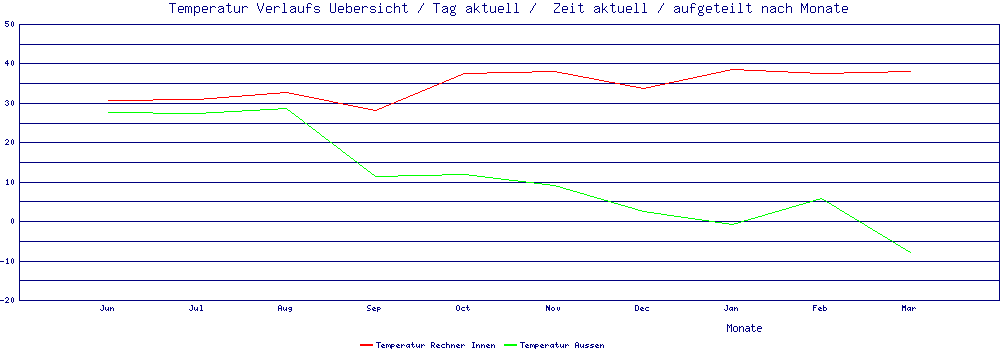
Now let's tackle the graphic output. The program (download at the end of the article) generates curve graphics, for more graphics look at the other GD moduls.
What is more, the program is using the CGI modul which enables HTML output with Perl. I am refering here to the numerous descriptions on this in the Internet.
Back to the program. It comprises a main part and two subprograms. One subprogram is responsible for the SQL query, the second is for the graphics.
Only three queries are carried out by the main part and the data are pased on to the subprograms.
Only the queries need to be changed to generate different graphical output.
Finally, I want to show you some SQL queries since they are the main subject of this example.
    select tag, monat, zeit,
     DATE_FORMAT(dbtime,'%Y-%c-%d %H:%i:%s') as dbtime, messung
       from sensor0
       order by id desc
         limit 5;
    select tag, monat, zeit,
     DATE_FORMAT(dbtime,'%Y-%c-%d %H:%i:%s') as dbtime, messung
       from sensor1
       where YEAR(dbtime) = YEAR(NOW())
         order by messung asc
         limit 1
    select tag, monat, zeit,
     DATE_FORMAT(dbtime,'%Y-%c-%d %H:%i:%s') as dbtime, messung
       from sensor1
       where YEAR(dbtime) = YEAR(NOW())
         order by messung desc
         limit 1
   select day, month, YEAR(dbtime) as Jahr,
     sum(messung)/count(*) as Durchschnitt
        from sensor1
       where YEAR(dbtime) = YEAR(NOW())
       and DAYOFMONTH(dbtime)= DAYOFMONTH(NOW())
       and MONTHNAME(dbtime) = MONTHNAME(NOW())
         group by DAYOFMONTH(dbtime)
I am always surprised how simple it is to write programs in Perl. Actually, they are not really written but copied and the sections combined; somehow all that is already existing somewhere in one form or another.
I hope, I was able to provide you with a small glimpse into the topics of Perl, CGI and MySQL.
|
|
Webpages maintained by the LinuxFocus Editor team
© Stefan Blechschmidt, FDL LinuxFocus.org |
Translation information:
|
2004-06-29, generated by lfparser version 2.46