![[LinuxFocus Image]](../../common/images/border-short.jpg)
| News Archives Map |
![[LinuxFocus Image]](../../common/images/border-short.jpg)
|
|
|
|
by Jose M. Laveda <jmlm(at)ctv.es> Translated to English by: Miguel A. Sepulveda and Ismael Ripoll <sepulveda(at)linuxfocus.org> Content: |
Debugging Code with dddAbstract:
The goal of this article is to show a number of basic concepts
to users who have never used a debugger before or having used
it, is looking for a graphical environment more pleasant for
his daily work. Much can be written about the capabilities and
robustness of the debugger described (gdb) however we decided
to keep things simple for didactical purposes, as usual :)
|
" Once upon a time there was a programmer whose only task when finding a bug in his code was:
/*Code*/He was forced to insert numerous times these lines through out his source code in order to inspect the values of the program variables during running-time. It was a hard task and made his life painful and the cost of debugging his code twice the cost of writing it(..)".
Who has never found himself in such a situation? often there is an error in our program, we have changed and tried everything, at this point we are almost convinced it is "the fault of the compiler" since there is little less to try....Well here is were the debugging software comes into play.
A debugger lets you control the execution of a program step by step, this way it is easy to examine the state of variables, their definitions, what would happen upon certain conditions, etc.. All this, once again, iteratively while the code being debugged is running. If this pedestrian definition is not very clear I hope to make it more transparent during the article.
What would happen if the programmer in our story had a debugger named "spy" that would let him do the following:
jose# spy my_programand what if after invoking "spy" our programmer could take the following actions:
spy > execute my_program "up to line number 50"Very likely at this moment our imaginary programmer would be jumping of happiness because he finally found the reason for the bug.
Clearly the tool named "spy" has been very useful because it
has let the programmer to execute the program at his will while
examining the values and definitions of the programs variables.
This is in essence a DEBUGGER, very grossly pictured of
course.
Warning !!: Debuggers can only operate on programs that have been compiled with the debug option, "-g" in the case of the GNU gcc compiler.
There is a debugging tool available to all LINUX users (and in many other platforms), is the GDB " The GNU Source-Level Debugger". It is available for the same price, and under the same license than the operative system you are most likely to read this article, the GNU General Public License. It allows to debug code written in C, C++, Modula-2 and assembler.
Most likely the Linux-distribution you are currently running includes it, if not change your distribution or find the sources somewhere in the net where it is available in zillions of places ;).
Say you downloaded the sources into your /usr/src directory, then go to "/usr/src/gdb-4.xxxx/gdb", type "./configure" and change to the directory "doc". Here you can build the documentation for gdb by running "make gdb.dvi;make refcard.dvi" both files are easily viewed or printable on any Linux box.
Rather than continuing with a detailed presentation of the functioning of gdb and all its commands, it will be more useful for the novice user to become familiar with a much more user-friendly environment "ddd" which stands for Display Data Debugger.
The ddd environment, generally speaking, provides and interface more user-friendly and also much easier to configure for the debugging session. However we must remark that ddd is just a graphical environment on top of gdb, therefore ddd needs the later for its proper execution. In fact ddd allows the user to manipulate gdb directly if desired. There are other debuggers that could be used with ddd, like dbx and xdb.
A good source of information about ddd is http://www.cs.tu-bs.de/softech/ddd/ although if you use Red Hat the sources can already be found in .rpm format. There may be two versions of ddd, one with the Motif library compiled dynamically and the other statically. The static version is for those users who do not own a Motif library
I ignore the current situation of ddd versus LESSTIF (http://www.lesstif.org), I am not familiar with the recent status of the lesstif, a freeware implementation of the Motif graphic library. Not long ago ddd only compiled and work under lesstif thanks to a patch; I used it on a kernel 1.2.13 with lesstif 0.75 (I think ;). Please check the page of the lesstif project to learn more about the status of that project.
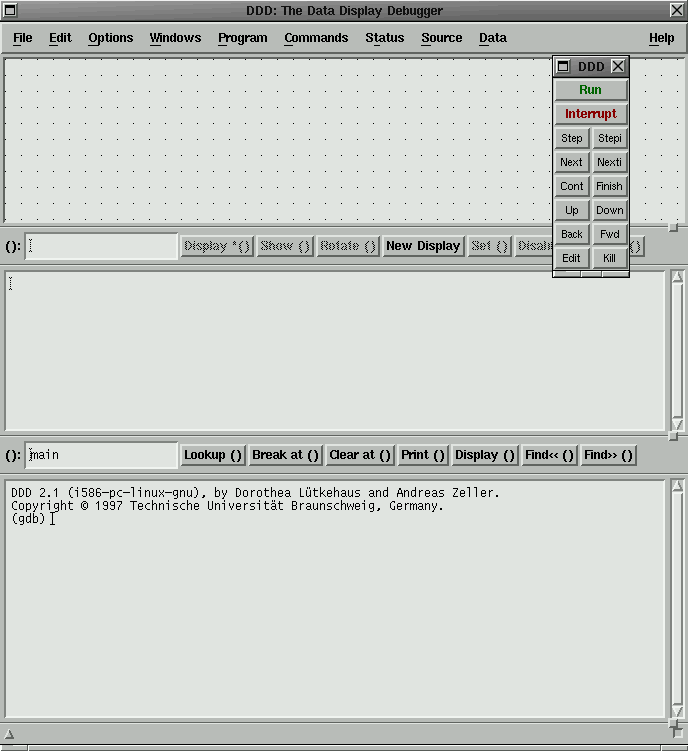
Getting to the point, upon running ddd we get:
There are three different ways of invoking ddd; the one already mentioned and the following two:
ddd <program> coreThe file named "core" is produced whenever a program crashes and it contains useful information concerning the status of the program during the error that generate the crash. If your system does not generate core dumps then take a look at the environment variables for the core ('ulimit -a' it shows all of them, also use 'ulimit -c <value>' to define the maximum size or other values of interest).
The proccess id allows us to inspect the program during runtime.
ddd's graphical environment always provides multiple ways of performing a task; I cannot describe all of them, only the simplest or more direct ones. Also notice that the lowest subwindow of the main ddd console shows a log of all the transactions executed by ddd. The log window can be very useful to learn the usage of gdb from the command line.
Figure 1 shows that the main window is divided into three subwindows. The lowest corresponds to the "pure" debugger console (gdb in our case), here we can input gdb commands directly as if we did not have the ddd interface at all. The middle subwindow shows the source for the program, and the upper subwindow provides a graphical interface to the variables and object of the program. Finally the tool bar is a floating window that allow the control and execution of ddd commands.
In addition to the main window there is an execution window for the running process and another one for the source code of the program to be debugged. Both are optional.
ddd comes with multiple help resources that provide users with necessary information at any moment during the debugging session. For example, a dialog box always appears whenever the cursor moves over a variable or any of the buttons in the interface; this dialog box provides relevant information about the object underneath. Also the lower part of the main window has the ddd status line which shows what command is currently running and its output status. To the right one finds a pop-up menu with all the available help. More help is available pushing the key F1 and selecting a topic from a floating window. And last one can type in the gdb console (bottom subwindow) the command "help" to obtain general help about the debugger or specific information about any of its commands.
By default the ddd interface offers three subwindows joined in a single frame. However the "Preferences" menu one can request a ddd interface with separated windows instead of the default.
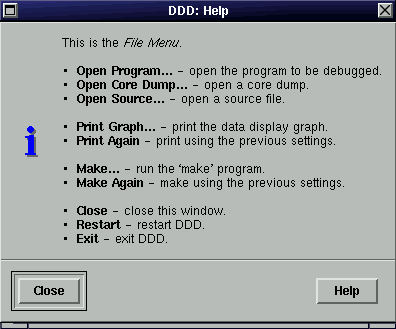
The "DDD:Debugger Console" is the place to take our first steps on learning to use the debugger; experience users already familiarized with gdb can easily operate ddd from there. In my experience it helps to watch what happens on the Debugger console as we launch commands through the graphical interface. The option "Commands->Command History" let us see in a separate window the list all the previous commands launched till present.
To learn about the capabilities and specifics of DDD is better to go directly to the original documentation. In any case I will describe how to perform a few simple tasks from the debugger directly.
Source code for a debugging session can be loaded from the ddd command line or through the menu option "File"; the contents of the source file are shown in the corresponding area. From this moment on we can already navigate through the source code, examine the value and type of a variable, execute the program while controlling its execution...
The output of a program can be monitored by an execution window (Options -> Run in Execution Window ), or by watching its output on the debugger console (this method will not work if the program is design to run under Motif or other GUI-oriented library).
Try placing the cursor over any variable of the source code and you will see its current value on the state line of ddd. Also if you push the mouse right button the following menu appears:
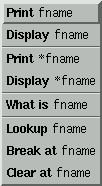
This menu lets us inspect the value of the variable "fname", in the lower window, show it in the upper window ("drawing area "), whether it is a real variable or only pointer (a variable containing the memory address of other variable, not its value). Furthermore "What is" shows the structure or type of the shown variable; Lookup permits the search of other occurrences of the same. Finally Break at and Clear at allow the handling of the so-called breakpoints) which we will explain shortly.
A number of options are also available in the bar of buttons under area of the source code, just type the parameter wanted in the left empty box and choose the appropriate action.
A break-point lets execute the program up to a specified line of the program; execution then halts and the user can inspect the value of the variables up to that point, continue executing the program one step at a time by hand, review the (threads).... etc. Take into account that, in general, in the absence of any breakpoints in the program, this finishes it execution correctly or crashes due to an existing bug, at then it is too late to launch an action to inspect the program, it is necessary to debug the program " during run-time".
To place a breakpoint on your source code do the following:
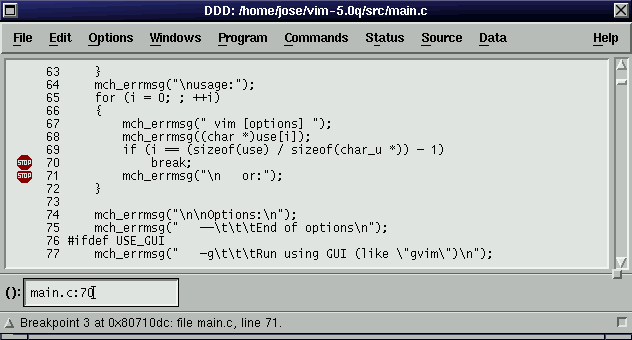
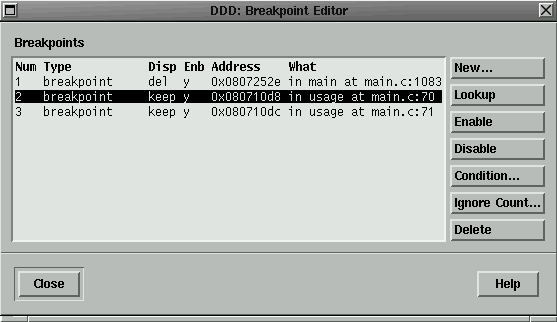
In the figure you can observe two breakpoints in the lines 70 and 71 of the source code, the symbol for breakpoint is quite self-explanatory.
The following menu serves to manage the breakpoints:

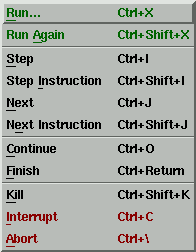
It can be seen the parallelism between the button window and the menu bar.
We can start and stop the program, if we use the menu bar then it is possible to give some parameters to the program with a dialog window. Step executes one program line more (step by step), this is, if there is a function call then the debugger go to the beginning of the function and will wait for the next Step command. On the other hand, the Next command execute a function call as an atomic program line, executing at once the full function code.
Continue permits to continue with the execution of the stopped program after a breakpoint stop. Kill, Interrupt y Abort are used to interrupt the program execution.
Probably, the most exciting characteristic of this graphical tool is the data window display, in the upper side of the window. We can see graphically the structure and the contents of the data, as well as the dependencies between them. In the next example, an array (Arguments) and four of its elements.
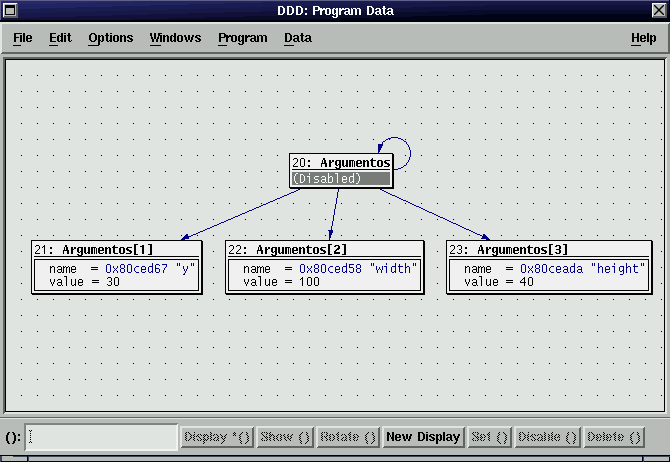
This window can display a wide variety of information, just take a look at the menu Data->More Status Displays , where you can configure all that you want to see on the data window. In the previous example, we can also display the processor register values, the required dynamic libraries and the execution state of the program:
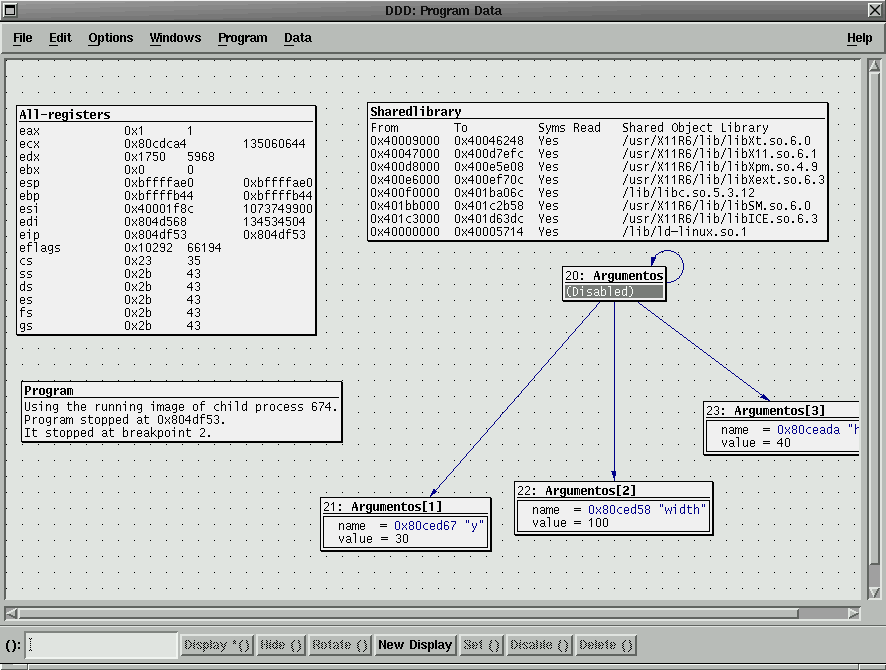
The ddd environment can be customized from the same program with the menu Options->Preferences, and also by the classical resource method of the Motif applications (file $HOME/.dddinit). It is out of the scope of this article to describe all the customizable resources and how to do it.
It is very advisable to read the manual that comes with the ddd (ddd.ps) and the manual of the debugger it self ("Debugging with GDB"). Nevertheless, the user with just a little of curiosity can teach him/her self in little time, it is only needed to debug a well known code to discover all the debugging capabilities.
And finally, my apologizes if I made any mistakes in the article :)
|
Webpages maintained by the LinuxFocus Editor team
© Jose M. Laveda, FDL LinuxFocus.org |
Translation information:
|
2002-11-04, generated by lfparser version 2.34